




pgBadger duplicate query count testing starts with a known counting unit. Our original synthetic ledger contains 20 executions. Two equivalent logging representations describe those executions with either 20 or 28 logical records. We ran each input through pinned pgBadger 13.2 and 13.3, producing four actual reports.
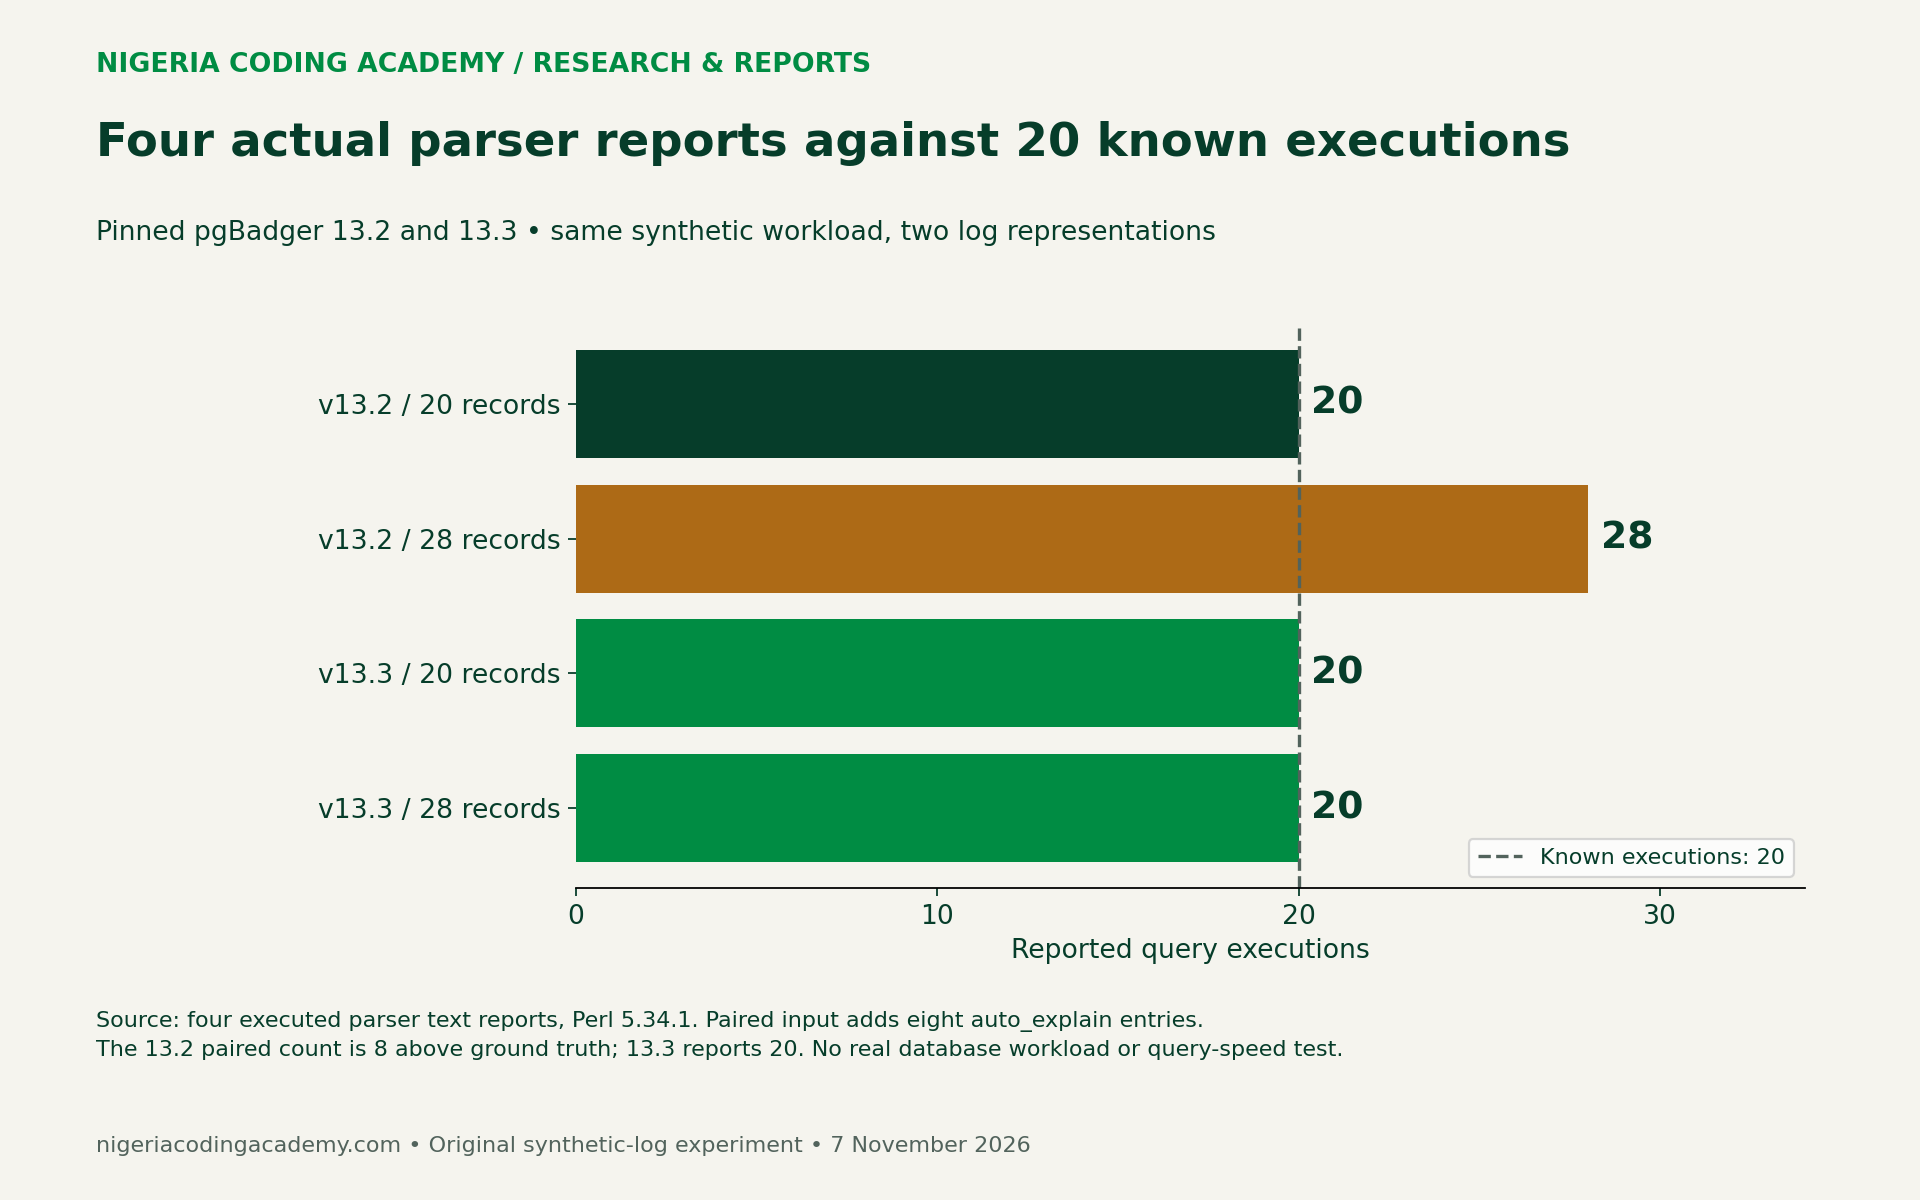
The result was specific: both versions reported 20 queries for the single-record input. For the paired-record input, 13.2 reported 28, while 13.3 reported 20. This fixture reproduces the reported counting issue under its declared settings. It does not establish how often real installations are affected or show that database queries became faster.
Why the 13.3 release matters for measurement
The 3 November PostgreSQL release notice, posted by HexaCluster, describes a pgBadger 13.3 fix for the same execution being counted twice when logged through both log_min_duration_statement and auto_explain. It also lists work involving multiline statements, user filtering and concurrent-run temporary filenames.
The maintainer’s tagged 13.3 release confirms the change. These release notes establish that a fix shipped. They do not quantify affected Nigerian deployments or imply that every earlier pgBadger report doubled its total.
A course-enrolment or inventory demo gives Nigerian learners a safe way to examine this distinction. We use invented SQL, users and log entries. No PostgreSQL server was started, no query was executed against a database, and no customer log was collected.
Define ground truth before opening the report
The manifest assigns execution IDs E01 through E20. Every ID has a timestamp, backend identifier, fictional user, query shape and selected duration. These IDs define the expected execution count independently of the parser output.
We use four SQL shapes, each executed five times in the fictional ledger. One shape spans multiple physical lines. Repeated SQL is intentional: the second execution of the same statement remains a second execution. An approach that keeps only unique query text would reduce 20 executions to four shapes and discard genuine repetitions.
The fixture alternates two fictional users and two backend identifiers. Execution timestamps are two seconds apart. For the eight chosen executions with extra plan records, the plan and statement share the timestamp and backend context. The selected plan duration is one millisecond below its corresponding statement duration.
These are controlled construction choices, not a model of typical Nigerian database traffic. They make the expected association inspectable. A different logging format, precision, ordering or workload needs its own test.
Count records, physical lines and executions separately
The single-record representation contains one duration/statement record per execution. Its multiline statements increase the physical line count to 30, while the logical record and execution counts stay at 20.
The paired-record representation adds eight matching auto_explain records. It therefore contains 28 timestamp-prefixed logical records and 58 physical lines, describing the same 20 execution IDs. We count logical entries by the fixture’s timestamp prefix, not by splitting every newline into an execution.
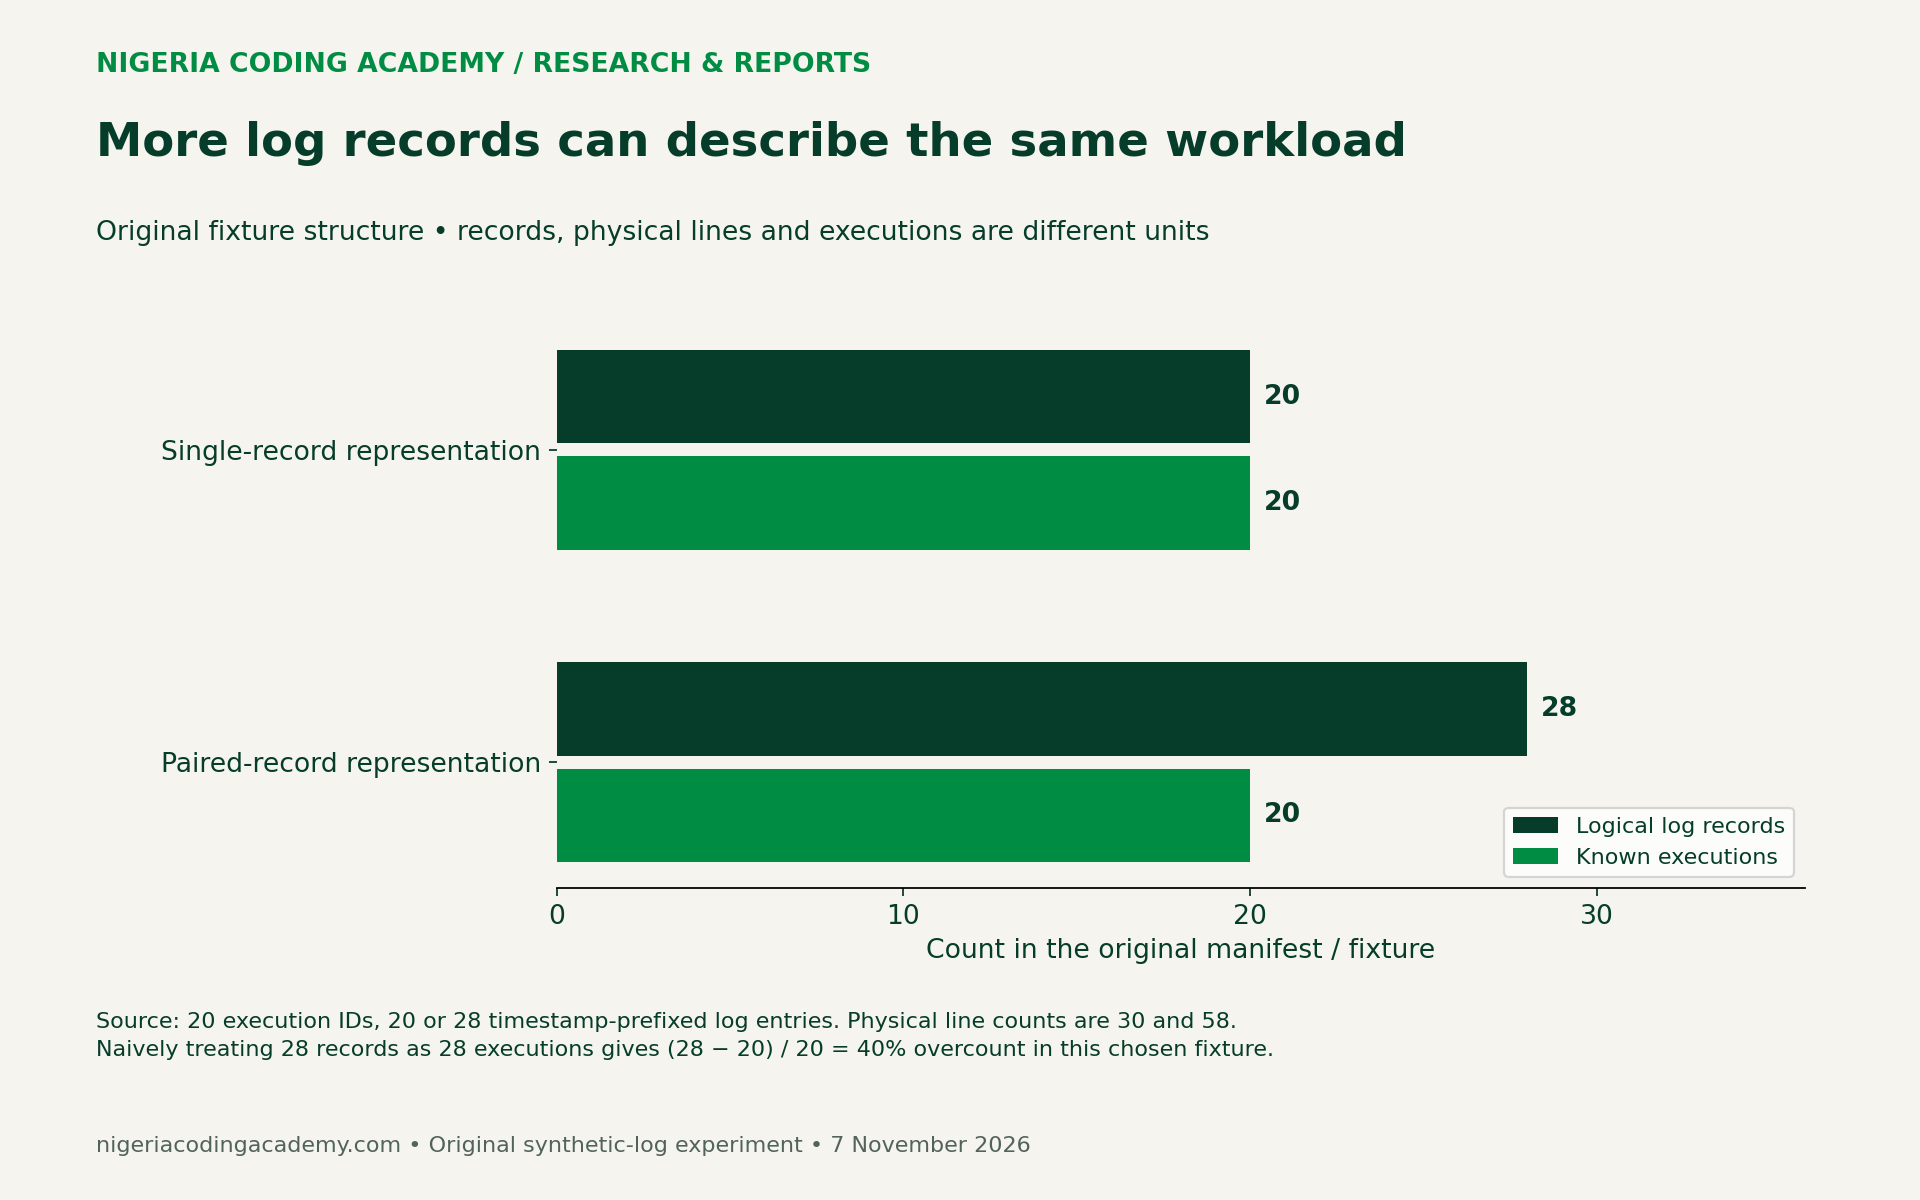
The naive overcount is (28 − 20) / 20 × 100 = 40%. Before running a parser, this is only arithmetic about the constructed input. It becomes a measured parser error only if an actual report returns 28 against the known 20-execution manifest.
The parser’s progress and log-entry diagnostics serve a different purpose. Our comparison extracts the report’s explicit Number of queries field and reconciles it with the execution ledger. We do not treat a progress counter as the answer to an execution-count question.
Four actual parser runs, with fixed settings
We downloaded the unmodified parser scripts from the official repository’s v13.2 and v13.3 tags. The retained source hashes pin the exact files. Both report their expected version labels. The local runtime is Perl 5.34.1 on macOS 27.0.1, build 26A434.
Each run uses stderr input, the declared prefix %m [%p] %u@%d, text output and one parser job. We apply no user filter and use no incremental mode. Those fixed choices keep this comparison focused on the two representations and two parser versions.
Unlock Your Unique Tech Path
Get expert tech consulting tailored just for you. Receive personalized advice and solutions within 1-3 business days.
Get Started| Parser version | Logical input records | Known executions | Reported queries | Count error |
|---|---|---|---|---|
| 13.2 | 20 | 20 | 20 | 0 |
| 13.2 | 28 | 20 | 28 | +8 |
| 13.3 | 20 | 20 | 20 | 0 |
| 13.3 | 28 | 20 | 20 | 0 |
All four commands exited successfully. That success alone would not prove the count was right: the 13.2 paired-record report exited successfully while reporting eight extra queries. The independent ledger supplies the expected answer.
Verify repeated and multiline SQL survive reconciliation
An overall total can conceal offsetting errors. Therefore, we also extracted the four normalized-shape counts from each report’s most-frequent-query section. The result table has 16 shape-level observations: four shapes in each of four reports.
In the paired-record input, each shape has five actual execution IDs and two extra plan records. Version 13.2 reports seven executions for each shape. Version 13.3 reports five for each, including the selected multiline price query.
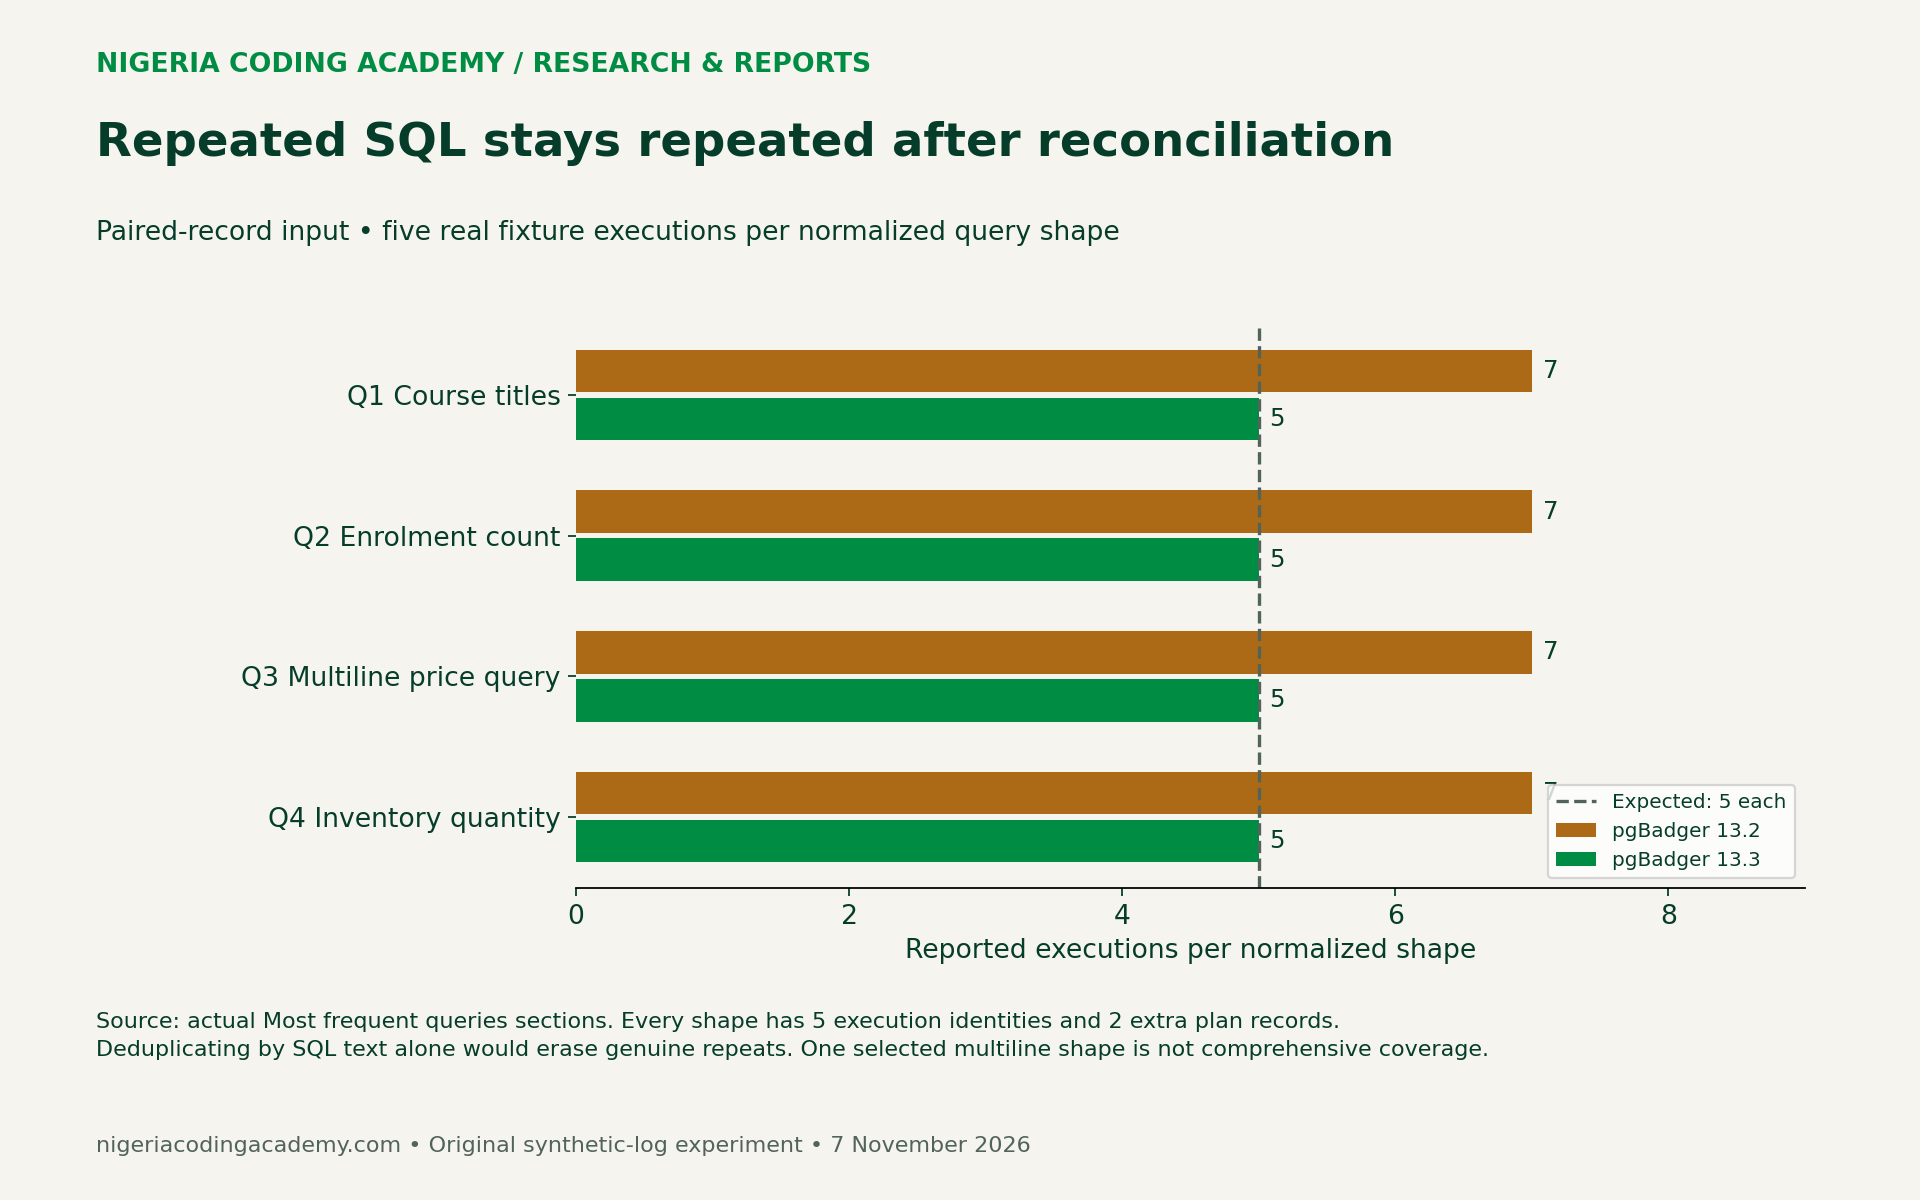
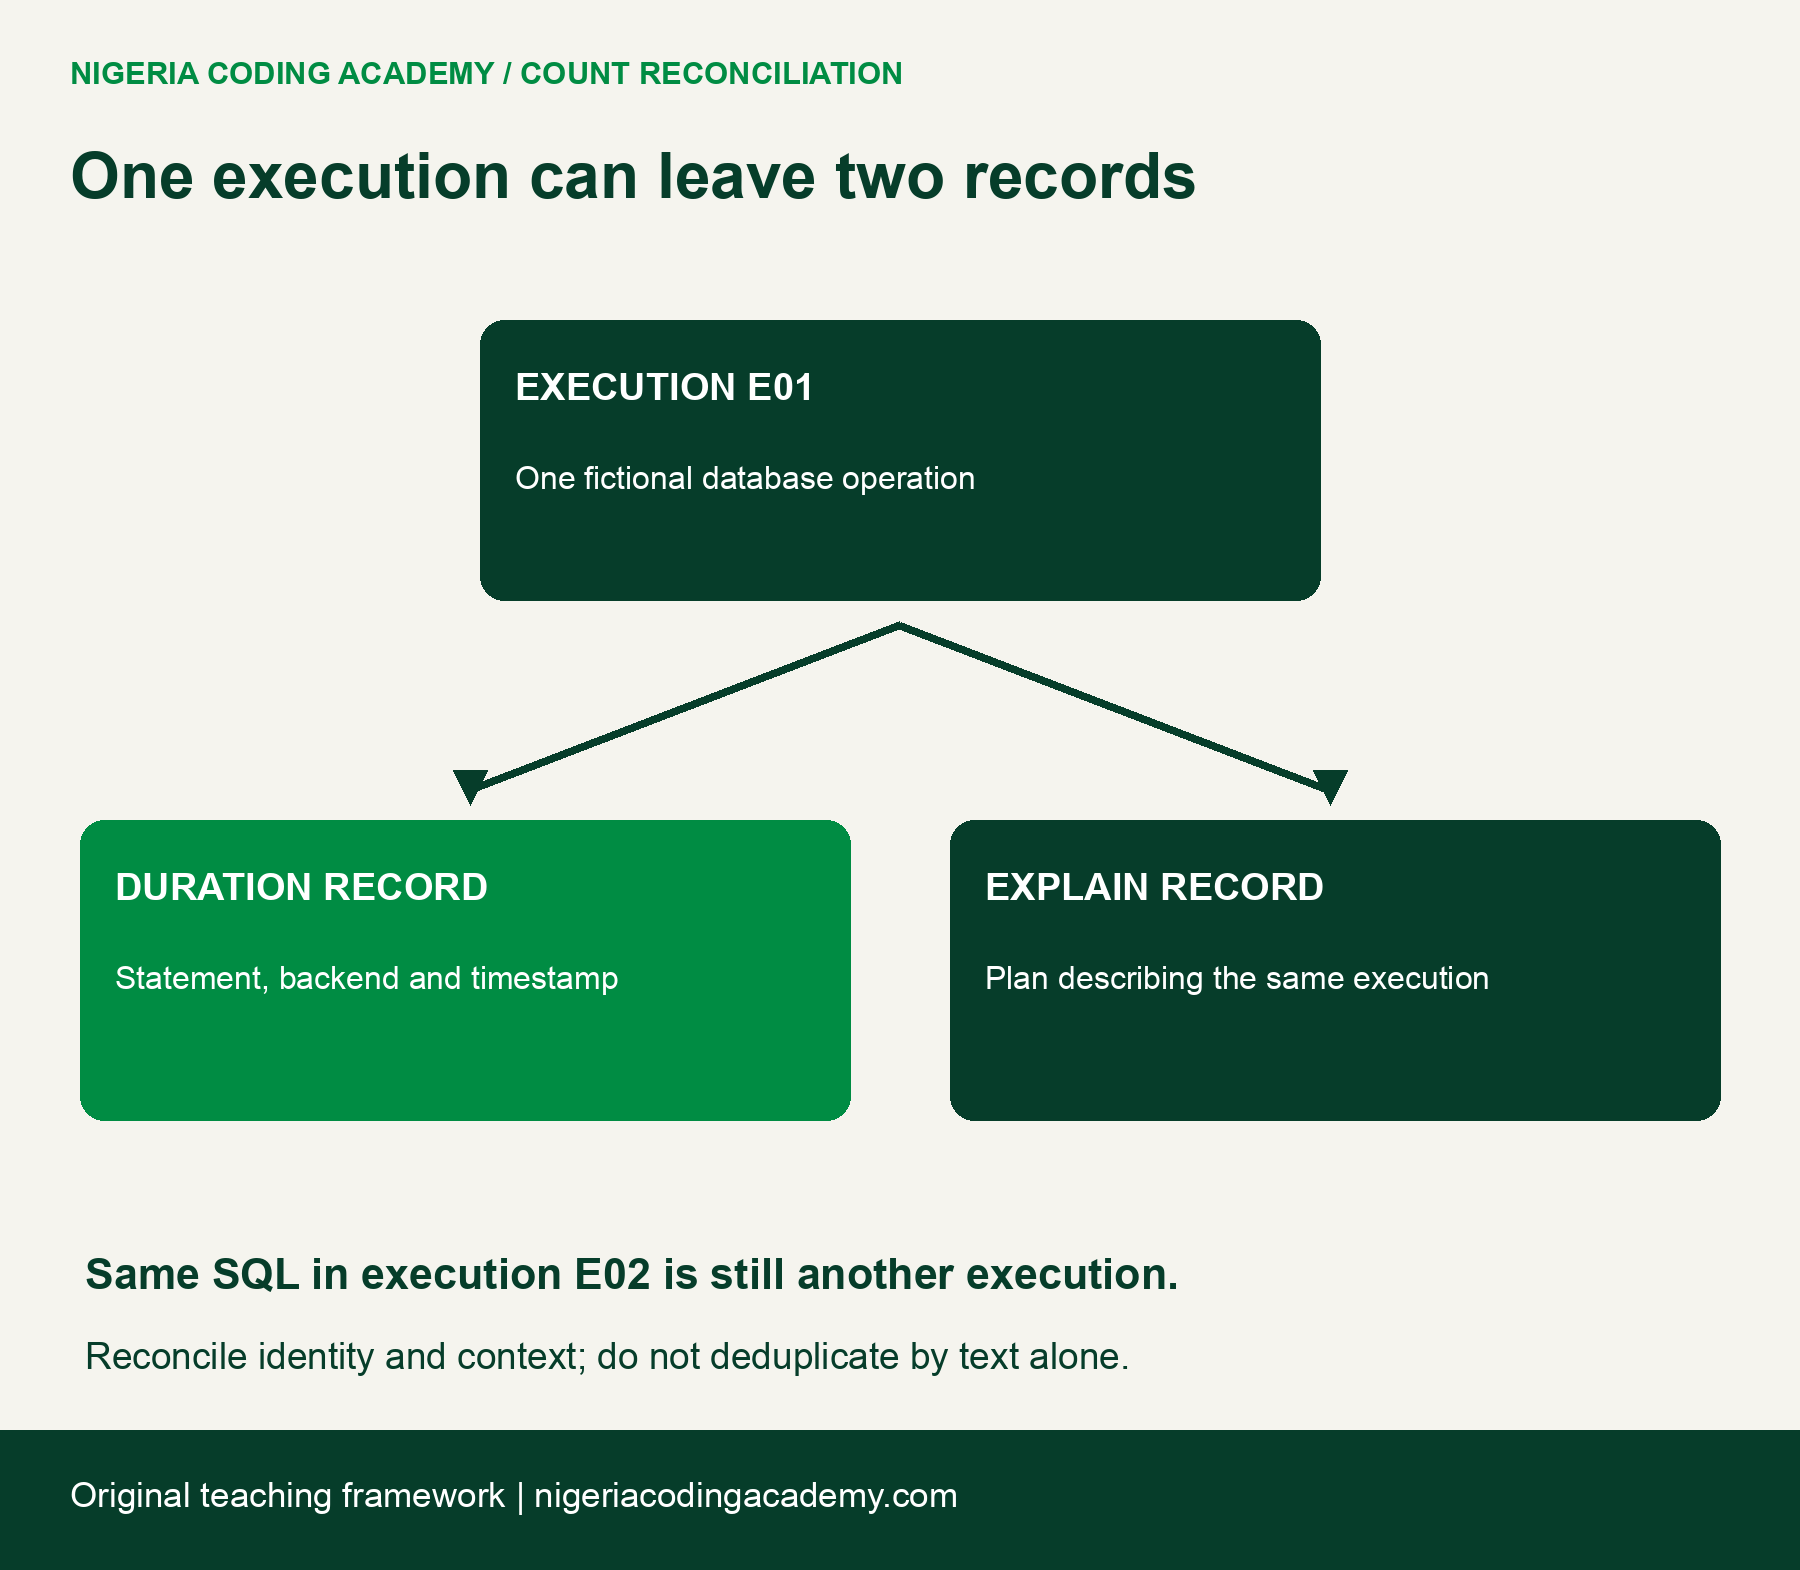
This is stronger evidence than deduplicating the output by SQL text. We want two records for E01 to describe one execution, while E02 remains a separate execution even if it uses the same SQL. The infographic makes those relationships explicit.
Reproduce the comparison without private logs
Download the pgBadger reproducibility pack. It includes both pinned upstream parser scripts and their licenses, original fixture-generation code, both logs, the execution manifest, all four text reports and command/environment ledgers.
From the extracted root, run python3 scripts/run_parser_study.py with Python 3 and Perl installed. The harness creates fictional files and local reports only. It makes no network calls and connects to no database. Retained public report copies replace machine-local path prefixes with relative paths; query text and reported counts are preserved.
- Twenty-execution ground-truth manifest (CSV)
- Four actual parser comparisons (CSV)
- Sixteen query-shape observations (CSV)
- Blank count-reconciliation worksheet (CSV)
Original fictional data are CC0. Original teaching code uses the included MIT license. The upstream pgBadger scripts retain their PostgreSQL license. Review the supplied files before adapting a fixture to a different log format or parser setting.
Interpret a corrected denominator carefully
A corrected count is a measurement change. It is not evidence that queries now execute more quickly, use less CPU or cost less to run. Our study does not benchmark parser speed or database performance. The same fictional durations appear in both logging representations.
For an existing report, first identify the unit you need: execution, normalized shape, logical record or physical line. Then record parser version, prefix, enabled logging sources and filters. Reconcile against an independent, appropriate reference before interpreting an apparent workload change.
Our CI checker exercise shows why successful process status can coexist with incomplete evidence. Our request cancellation study similarly distinguishes the events behind a headline label. Here the useful question is what the dashboard counted.
Limits and citation: Nigeria Coding Academy, original synthetic-log comparison, 7 November 2026. Four executed reports reproduce the selected double-counting case; they do not estimate defect prevalence, comprehensively test all release fixes or evaluate a Nigerian production system. SQL logs can expose private information, so these downloadable examples remain entirely fictional.


